For oncology studies, we need to compute ORR which stands for Overall Response Rate. It is one of efficacy endpoints for the approval of cancer drugs and biologics. And it is determined by tumor assessments from radiological tests or physical examinations following RECIST criteria. Today in this post, I’d like to make an introduction on RECIST 1.1 and then clarify on how to compute related common statistics using PROC FREQ.
BOR (Best Overall Response)
RECIST (Response Evaluation Criteria in Solid Tumors) is a set of published rules that define when tumors in cancer patients improve (respond), stay the same (stabilize) or worsen (progress) during the treatment. Only patients with measurable disease at baseline should be included in protocols where objective tumor response is the primary endpoint.
Based on the size of lesions, lesions can be categorized as target lesions and non-target lesions. CT and MRI are the best available and reproducible methods to measure target lesions selected for response assessment.
Determine overall response for each assessment
Both target lesions and non-target lesions should be evaluated as scheduled per protocol. For target lesions, there are 5 kinds of evaluations: CR, PR, SD, PD and NE. As for non-target lesions, there are 4 types of evaluations: CR, Non-CR/Non-PD, PD and Not All Evaluated.
And as time goes on, some new lesions may emerge and for this case, response assessment for new lesions should also be recorded. For each scheduled visit or unscheduled visit (new lesions emerging), an overall repose should be given.
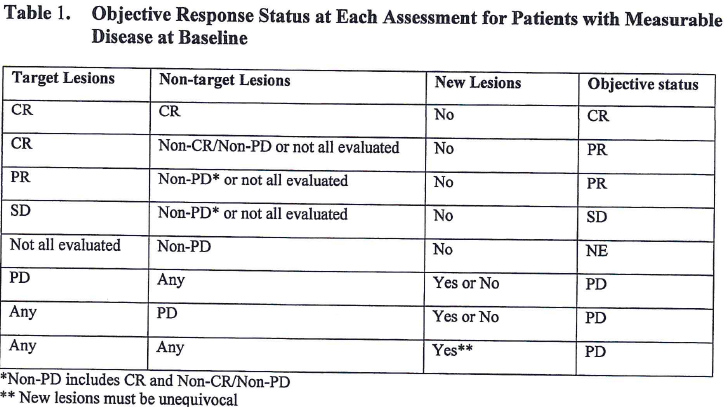
Table 1 explains how to derive overall response based on target lesion response, non-target lesion response as well as the emergence of new lesion for patients with measurable disease at Baseline. Let’s take the 1st line as an example and make an explanation. For one assessment, if target lesion response is CR, non-target lesion response is CR and there is no new lesion, investigator or independent reviewer will give an overall response of CR.
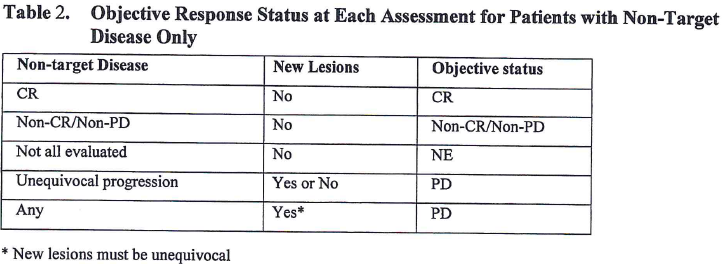
Table 2 explains how to derive overall response based on non-target lesion response and emergence of new lesion for patients with non-target disease at Baseline. Let’s also take the 1st line as an example and make an explanation. For one assessment, if non-target lesion response is CR and there is no new lesion, investigator or independent reviewer will give an overall response of CR.
Pick out BOR during Overall Response of a series of assessments
We need to put all overall responses (from the start of the treatment until disease progression/recurrence or start of new anti-cancer therapy) together and select the best response from them as <b>BOR</b> (Best Overall Response). Values of BOR can be CR (Complete Response), PR (Partial Response), SD (Stable Disease), PD (Progressive Disease) and NE (Not Evaluated). For patients with Non-target lesions only at baseline, value can also be Non-CR/Non-PD.
Suppose that a subject already has 5 assessments as below. In order to determine BOR, we have to choose the best value in ‘Overall Response’ column. Obviously, PR is the best one among SD and PR and therefore (unconfirmed) BOR for this case is PR.
| Assessment | Target Lesion | Non-target Lesion | New Lesion | Overall Response |
| 1 | SD | Non-CR/Non-PD | No | SD |
| 2 | SD | Non-CR/Non-PD | No | SD |
| 3 | PR | Non-CR/Non-PD | No | PR |
| 4 | PR | Non-CR/Non-PD | No | PR |
| 5 | PR | Non-CR/Non-PD | No | PR |
Unconfirmed BOR and Confirmed BOR
To avoid overestimating the response rate observed, confirmation on objective response should be made based on repeat tumor assessment. The objective response originally collected by CRA from investigators or independent reviewers are called Unconfirmed Response. Response derived base on rules on how to confirm BOR per RECIST hand book is called Confirmed Response. And BOR based on Unconfirmed Response is called Unconfirmed BOR while BOR based on Confirmed Response is called Confirmed BOR.
For below example, unconfirmed BOR is PR while confirmed BOR is SD. Because the rule to confirm response is very complex, here will describe and you can read the handbook by yourself.
| Assessment | Target Lesion | Non-target Lesion | New Lesion | Overall Response |
| 1 | PR | Non-CR/Non-PD | No | PR |
| 2 | SD | Non-CR/Non-PD | No | SD |
| 3 | SD | Non-CR/Non-PD | No | SD |
| 4 | SD | Non-CR/Non-PD | No | SD |
| 5 | SD | Non-CR/Non-PD | No | SD |
ORR (Overall Response Rate) and 95% CI
The overall response rate is defined as the percentage of patients with a best overall response of CR or PR relative to the appropriate analysis set (e.g. efficacy evaluable population). Let’s put it in another way, we can sum the number of patients with PR and CR together and then divide them by total number of subjects in a specific analysis set. If you derive ORR from unconfirmed BOR, you will get unconfirmed ORR. While if you derive ORR from confirmed BOR, you will get confirmed ORR. Usually, we are more interested in the later one.
Suppose that we have 10 subjects and their BOR are listed as below and these 10 subjects are entire efficacy evaluable population. From the following table, you can see that there are 3 patients with BOR of CR and 1 patient with BOR of PR. 3 plus 1 is 4 and 4/10 equals to 0.4, thus, ORR is 40% in this case.
| USUBJID | BOR |
| 001 | CR |
| 002 | CR |
| 003 | SD |
| 004 | PD |
| 005 | CR |
| 006 | PR |
| 007 | NE |
| 008 | SD |
| 009 | PD |
| 010 | SD |
Besides ORR, we also need to get 95% CI (binomial proportion confidence interval) for ORR. The Clopper-Pearson 95% CI can be get by applying below code. Here we need to get create a new variable TYP which can be used to compute binomial proportion.
Click here to hide/show code
data bor;
input subjid $ 1-3 avalc $ 5-6 ;
trtn = 1;
datalines;
001 CR
002 CR
003 SD
004 PD
005 CR
006 PR
007 NE
008 SD
009 PD
010 SD
;
run;
data bor;
set bor;
if avalc in (“CR” “PR”) then typ = 1;
else typ = 2;
run;
ods output OneWayFreqs = freq(rename = (frequency = count))
BinomialCLs = binomialCL(where=(Type = “Clopper-Pearson (Exact)”))
BinomialTest = test;
proc freq data=bor order=formatted;
by trtn;
tables typ/binomial(ac wilson exact) nocol norow nopercent;
run;
ods output close;
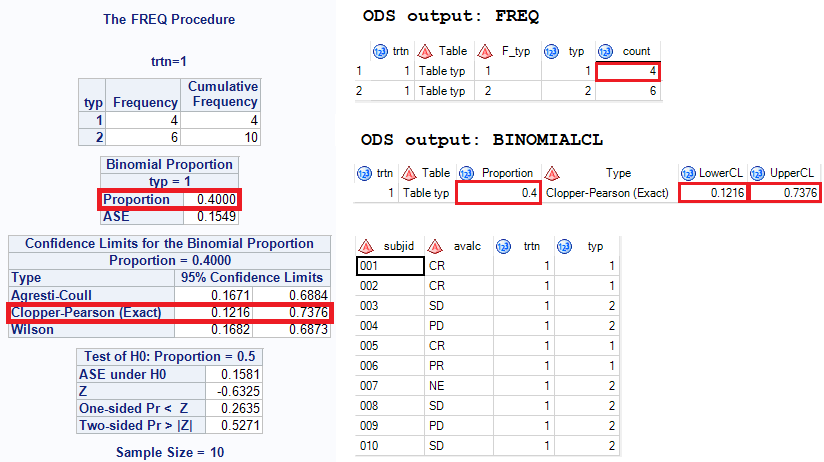
And here is what you will get and you can see that 95% CI is 0.1216 and 0.7376.
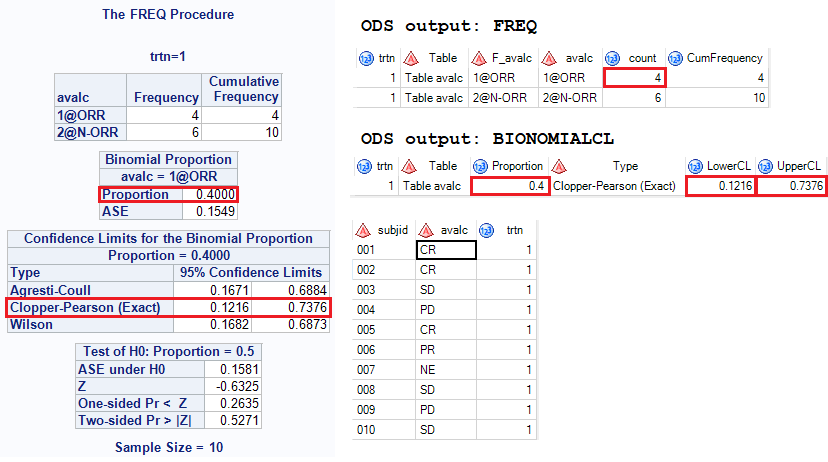
If you are familiar with format and there is no need to derive variable TYP anymore. Here is the full code and corresponding output. A format $bor is created and put response into two categories as we need to get proportion of CR + PR. “1@” and “2@” applied here is only for order purpose.
Click here to hide/show code
data bor;
input subjid $ 1-3 avalc $ 5-6 ;
trtn = 1;
datalines;
001 CR
002 CR
003 SD
004 PD
005 CR
006 PR
007 NE
008 SD
009 PD
010 SD
;
run;
proc format;
value $bor
“CR”, “PR” = “1@ORR”
“SD”, “PD”, “NE” = “2@N-ORR”
;
run;
ods output OneWayFreqs = freq(rename = (frequency = count))
BinomialCLs = binomialCL(where=(Type = “Clopper-Pearson (Exact)”))
BinomialTest = test;
proc freq data=bor order=formatted;
by trtn;
tables avalc/binomial(ac wilson exact) nocol norow nopercent;
format avalc $bor.;
run;
ods output close;

