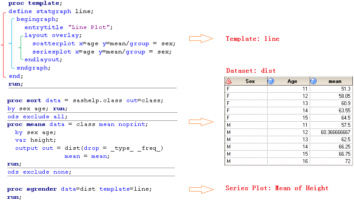
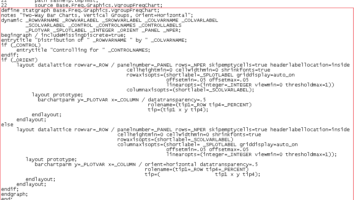
An Example Showing How to customize your GTL graph using annotation
GTL can enable you to add graphics elements to a graph using ODS Statistical Graphics (SG) annotation instructions which are stored in a SAS dataset. It enables you to separate


