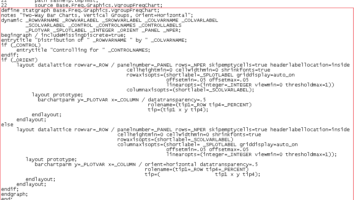
Relationship between SAS Statistical Graphics/SAS Analytical produre and Graph Template Language (GTL)
SAS Statistical Graphics (SG) Procedures such as PROC PLOT, PROC CHART, PROC GPLOT, PROC GCHART are used by most of us when creating a graph. What we only need to

