SAS Statistical Graphics (SG) Procedures such as PROC PLOT, PROC CHART, PROC GPLOT, PROC GCHART are used by most of us when creating a graph. What we only need to do is to select appropriate statements and then modify some options. Quite simple, right? However, there are disadvantages. For example, we need to create dummy data for a group that has no data in order to include all groups in lengend. Moreover, you have to master annotation in order to place text or draw line in certain region of a whole graph. Thus you have to check axis coordinates to refresh your mind time from time if you are not skilled. Very annoying, right? Luckily, SAS provide us another choice to develop graph – Graph Template Language (GTL) – which can enable us to produce complex graphs and high quality graphical output. In this post, I will only focus on the relationship between SAS procedures and GTL and will write detailed knowledge in future.
Relationship between SAS Statistical Graphics Produre and GTL
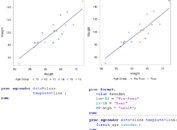
In fact, all of the graphs that are created by SAS Statistical Graphics Procedures are generated using GTL. In another word, the SG procedures are in fact a set of graphics procedures that apply the power of GTL behind the scenes to create commonly used graphs using a simple and concise syntax.
Relationship between SAS Analytical Produre and GTL
Besides Statistical Graphics Procedures, SAS analytical procedures such as PROC CORR, PROC LIFETEST, PROC FREQ also use the power of GTL to produce graphs. The STATGRAPH templates that SAS analytical procedures use to generate graph are defined by the procedure writers and shipped with SAS. These templates are stored in the appropriate subfolder of the SASHELP.TMPLMST item store.
Let’s take PROC FREQ as an example to make a clarification. First of all, we sort SASHELP.CLASS by SEX, AGE and create a new sas dataset named CLASS. Then run PROC FREQ on CLASS.
Click here to hide/show code
proc sort data = sashelp.class out=class; by sex age; run;
ods trace on;
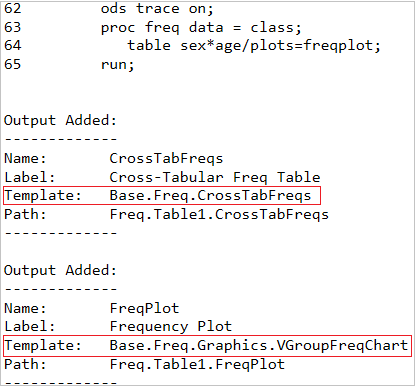
proc freq data = class;
table sex*age/plots=freqplot;
run;
ods trace off;
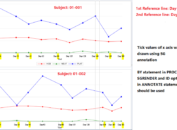
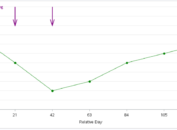
By submitting above code, we can get a Cross-Tabular Freq Table and a Frequency Plot in listing destination. SAS use a Table template to produce Cross-Tabular Freq Table and a STATGRAPH template to create Frequency Plot, respectively.

If you look at above code carefully, you would have already noticed the existence of “ODS TRACE ON” and “ODS TRACE OFF”. The ODS TRACE ON statement tells SAS to print information about about the output objects in the log. Below figure shows part of log. You can see that Base.Freq.CrossTabFreqs is a table template while Base.Freq.Graphics.VgroupFreqChart is a graph template. And these two templates are exactly those used by SAS session to produce above table and figure.
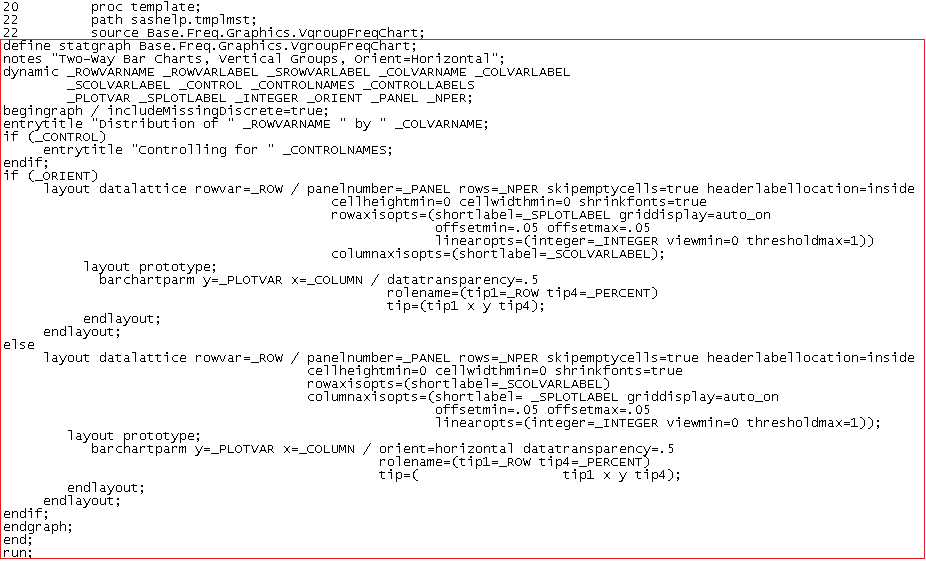
This part of code can enable SAS to print Base.Freq.Graphics.VgroupFreqChart in log.
Click here to hide/show code
proc template;
path sashelp.tmplmst;
source Base.Freq.Graphics.VgroupFreqChart;
run;
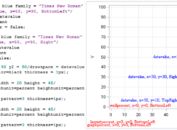
Code in red box is exactly the graph template written using GTL. The structure is different from what we usually use such as Base SAS and SQL. It consists of several blocks. A block is a pair of statements that indicate the beginning and end of a syntax unit. For example, BEGINGRAPH and EDNGRAPH is a block. LAYOUT and ENDLAYOUT is a block. There are three LAYOUT/ENDLAYOUT blocks, two are nested within one.
Note:
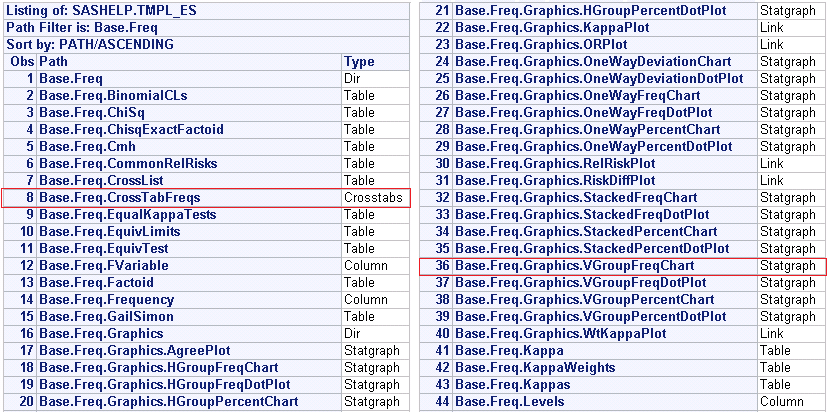
If you are interested in kowning all the templates related to a procedure like PROC FREQ, you can submit below code in SAS.
Click here to hide/show code
proc template;
path sashelp.tmplmst;
list base.freq;
run;
Here are a list some table templates and statgraph templates for PROC FREQ procedure. The 8th and 36th are what discussed in above paragraph.