GTL can enable you to add graphics elements to a graph using ODS Statistical Graphics (SG) annotation instructions which are stored in a SAS dataset. It enables you to separate the annotation graphics instructions from your template code. And you don’t have to modify your template code if you’d like to modify your annotations. Since you only need to update your annotation data set.
How SG annotation works in GTL Graph
As a matter of fact, SG annotation applies DRAW statement to add graphic elements like text, arrows (or lines), geometric shapes (such as ovals, rectangles, polylines, polygons) and images to your graph. It just turns DRAW statement into variables and stored variables in a dataset. If you are not familiar with GTL DRAW statement, please read one of my previous posts.
Graph to be Drawn in This Post
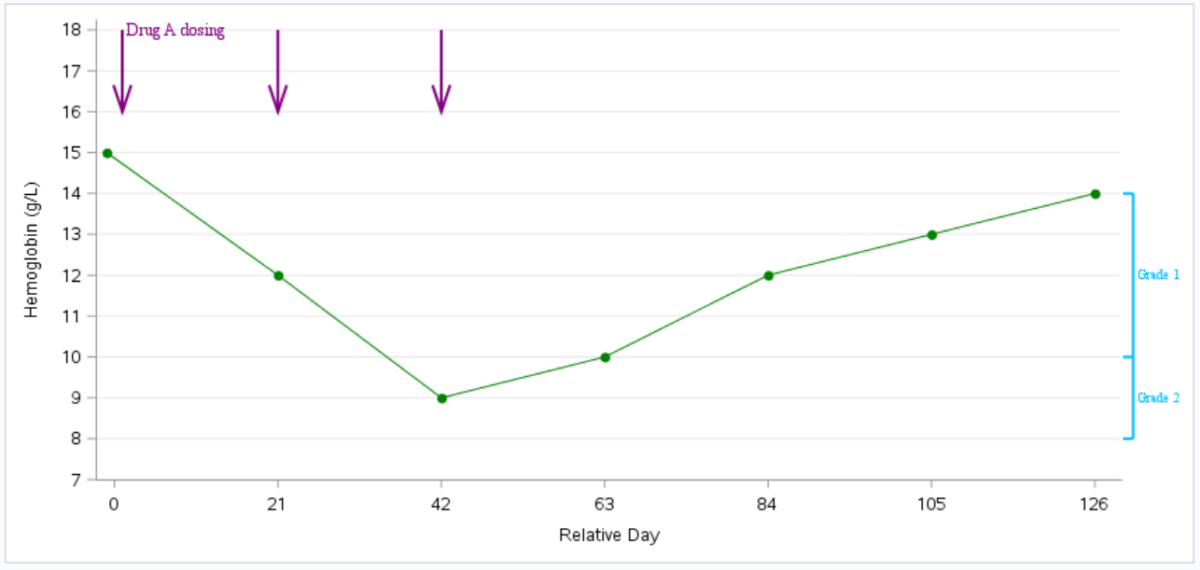
Suppose that we need to draw a graph about hemoglobin values over time together with dosing information and CTCAE grade information.

Sample data used in this post
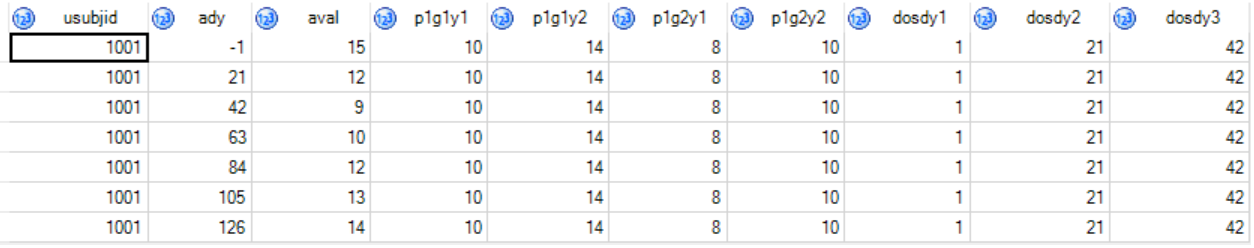
ADY is relative day of LB assessment day to start date of study drug (LBDT). And it will be used to draw x axis. AVAL is values of hemoglobin and will be used to draw y axis.
Assume that this subject 1001 is an adult male and his normal range for hemoglobin is 14 to 18 g/L. Lower level of hemoglobin is Anemia. Anemia is an adverse event. In our industry, CTCAE can be used to clarify the severity of AE. Here I only include criteria to determine the grade 1 and grade 2 of Anemia. Grade 1 of Anemia for adult male means that hemoglobin values will between 10 and 14 (not including). When hemoglobin values are between 8 and 10 (not including), anemia toxicity grade will be 2. Variables P1G1Y1, P1G1Y2 represent ranges of hemoglobin for Grade 1 Anemia. Variables P1G2Y1, P1G2Y2 represent ranges of hemoglobin for Grade 2 Anemia.
Variables DOSDY1, DOSDY2 and DOSDY3 represents relative day of drug administration to start date of study drug.
Click here to hide/show code
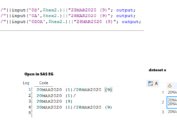
data adlb;
input usubjid ady aval;
datalines;
01001 -1 15
01001 21 12
01001 42 9
01001 63 10
01001 84 12
01001 105 13
01001 126 14
;
run;
data adlb;
set adlb;
p1g1y1 = 10;
p1g1y2 = 14;
p1g2y1 = 8;
p1g2y2 = 10;
dosdy1 = 1;
dosdy2 = 21;
dosdy3 = 42;
run;
proc sort data=adlb; by usubjid; run;
Annotation SAS Dataset to Draw Line
DRAWLINE statement here turns to variables like FUCTION, X1SPACE, X2SPACE, Y1SPACE, Y2SPACE, LINEPATTERN, X1, X2, Y1, Y2 LINECORLOR. Value of FUNCTION equals to “line”. Values of other variables are similar to that in DRAWLINE statement. ID variable was also defined to contain values of USUBJID. There are 5 functions here and 5 lines will be drawn,

Click here to hide/show code
*Annotation for line – DRAWLINE;
data anno1;
length function x1space y1space $200.;
set adlb;
retain function ‘line’ x1space ‘wallpercent’ x2space ‘wallpercent’ y1space ‘datavalue’
layer ‘front’ y2space ‘datavalue’ linepattern 1 linecolor ‘CX00BFFF’ ;
id = strip(usubjid);
array yya{2} p1g1y1 p1g2y1;
array yyb{2} p1g1y2 p1g2y2;
do i = 1 to 2;
if yya{i} ne . and yyb{i} ne . then do;
y1 = yya{i};
y2 = yyb{i};
x1 = 101;
x2 = 101;
output;
y1 = yya{i};
y2 = yya{i};
x1 = 100;
x2 = 101;
output;
y1 = yyb{i};
y2 = yyb{i};
x1 = 100;
x2 = 101;
output;
end;
end;
keep function x1space y1space x2space y2space x1 y1 x2 y2 layer linepattern id linecolor;
run;
proc sort nodupkey; by id function x1space y1space x2space y2space x1 y1 x2 y2; run;
Annotation SAS Dataset to Draw Arrow
Value of FUNCTION variable equals to “Arrow”. Each record represents an arrow.

Click here to hide/show code
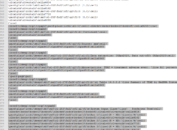
*Annotation for arrow – DRAWARROW;
data anno2;
length function x1space y1space $200.;
set adlb;
retain function ‘arrow’ x1space ‘datavalue’ x2space ‘datavalue’ y1space ‘datavalue’
layer ‘front’ y2space ‘datavalue’ linepattern 1 linecolor ‘purple’ ;
id = strip(usubjid);
array xxa{3} dosdy1 dosdy2 dosdy3;
do i = 1 to 3;
if xxa{i} ne . then do;
y1 = 18;
y2 = 16;
x1 = xxa{i};
x2 = xxa{i};
output;
end;
end;
keep function x1space y1space x2space y2space x1 y1 x2 y2 layer linepattern id linecolor;
run;
proc sort nodupkey; by id function x1space y1space x2space y2space x1 y1 x2 y2; run;
Annotation SAS Dataset to Draw Text
Value of FUNCTION variable equals to “TEXT”.

Click here to hide/show code
*Annotation for text – DRAWTEXT;
data anno3;
length function x1space y1space anchor label $200.;
set adlb;
retain function ‘text’ y1space ‘datavalue’ layer ‘font’ textfont ‘Times New Roman’;
array yya{2} p1g1y1 p1g2y1;
array yyb{2} p1g1y2 p1g2y2;
array xxa{2} (101 101 );
array grd{2} $ (“Grade 1” “Grade 2”);
array anc{2} $ (‘left’ ‘left’);
id = strip(usubjid);
do i = 1 to 2;
if yya{i} ne . and yyb{i} then do;
textcolor = ‘CX00BFFF’;
textsize = 7;
width = 250;
x1space = ‘wallpercent’;
y1 = (yya{i}+yyb{i})/2;
rotate = 0;
anchor = anc{i};
x1 = xxa{i};
label = grd{i};
output;
end;
end;
if dosdy1 ne . then do;
textcolor = ‘purple’;
textsize = 9;
width = 450;
x1space = ‘datavalue’;
y1 = 18;
rotate = 0;
anchor = “left”;
x1 = dosdy1;
label = “Drug A dosing”;
output;
end;
keep function x1space y1space x2space y2space x1 y1 layer id textcolor rotate anchor
textsize width textfont label;
run;
proc sort data=anno3 nodupkey; by id x1 y1; run;
Put All Annotation Datasets together
Click here to hide/show code
data anno;
set anno1 anno2 anno3;
run;
Template to draw line graph
ANNOTATE statement was applied to draw elements defined in ANNO dataset. I also applied ID option here. It specifies the ID column value of the annotations that are to be drawn. The ID column of the annotation data set contains a unique character that identifies the subset to which each annotation belongs. All annotations in the annotation data set with an ID column value that matches the specified annotation identifier are drawn. If the annotation data set does not contain an ID column or if no ID column value matches the specified identifier, then no annotations are drawn. It is very useful and can enable graphic elements drawn by ANNOTATION varies by page.
In our case, ID values equal to values of USUBJID. If there is only one subject, we can use ID = “1001” to draw annotations. When there are more than one subject, we have to use dynamic variable after “ID =”. In our post, we place USUBJID in BY statement and declared dynamic variable _byval1_ which was used after “ID =”.
Click here to hide/show code
proc template;
define statgraph plot;
dynamic _byval1_ ;
begingraph/ designwidth=850px designheight=400px;
layout overlay/pad=(right=40) walldisplay = none
yaxisopts=(label = “Hemoglobin (g/L)”
griddisplay = on
offsetmin = 0
linearopts =(tickvaluelist= (7 8 9 10 11 12 13 14 15 16 17 18)
viewmin = 7
viewmax = 18))
xaxisopts=(label = “Relative Day”
griddisplay = off
linearopts =(tickvaluelist= (0 21 42 63 84 105 126)
viewmin = -1
viewmax = 128));
seriesplot x = ady y= aval/display=(markers)
lineattrs = (color = green)
markerattrs = (symbol=circlefilled color = green);
annotate/id=_byval1_;
endlayout;
endgraph;
end;
quit;
PROC SGRENDER with SGANNO option to Draw Graph
Click here to hide/show code
proc sgrender data=adlb sganno=anno template=plot;
by usubjid;
quit;