GTL draw statements enable you to add text, arrows (or lines), geometric shapes (such as ovals, rectangles, polylines, polygons) and images to your graph. You can also use GTL draw statements to create a broken axis which are difficult to create by other means.
Drawing Space and Units
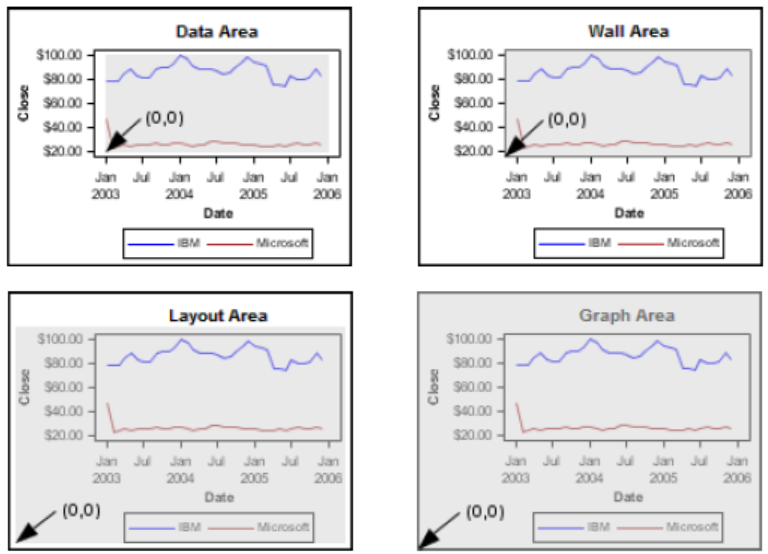
Drawing space which is the area of the graph in which the elements are drawn and drawing units must be specified if you’d like to draw graphics elements. There are 4 types of draw spaces: data, wall, layout and graph. Data area (shaded area in the figure on the top left corner) is the area of the graph in which the data is displayed. Area of the graph that is bound by the X and Y axes (including the secondary axes if used) is the wall area. The entire area of the layout container is the layout area which is the parent container of the draw statement. The graph area is the entire graph. For graphs that do not have axes, such as pie charts, both data area and wall area are not applicable. In this case, Region layout should be used.
Drawing space and units are specified together in a single value like following:
<DrawingSpace><Units>
Here displays 3 kinds of units, Pixel, Percent and Value, and in which drawing area that they are applicable. Pixel indicates that the coordinates are expressed in pixels in the drawing space. Percent indicates that coordinates are expressed as a percentage of the drawing space. While value indicates that the coordinates are expressed as values along the axis.
| Unit | Drawing Space |
| PIXEL | DATA, WALL LAYOUT, GRAPH |
| PERCENT | DATA, WALL, LAYOUT, GRAPH |
| VALUE | DATA |
A common drawing space and units for all X and Y coordinates can be specified using DRAWSPACE = option on each draw statement or BEGINGRAPH statement. If you specify DRAWSPACE = option in the BEGINGRAPH statement, all draw statements within the BEGINGRAPH/ENDGRAPH block will use the same space and units. If you would like to specify the drawing space and units for X and Y coordinates individually, use the XSPACE, YSAPCE, X1SPACE, Y1SPACE, X2SPACE, Y2SPACE on each draw statements.
Here is the code for you to practice and you can modify as you wish.
Click here to hide/show code
data test;
do y = 10 to 90 by 20;
x =50; output;
end;
run;
%let vlist = 0 10 20 30 40 50 60 70 80 90 100;
proc template;
define statgraph line;
begingraph;
layout lattice/pad=(bottom=20)
columns=2 rows=2 rowweights=(.5 .5) columnweights=(.5 .5);
*1st cell;
layout overlay/xaxisopts=(label=”X” griddisplay=on
linearopts =(tickvaluelist=(&vlist)
viewmin = 0 viewmax = 100))
yaxisopts=(label=”Y” griddisplay=on
linearopts =(tickvaluelist=(&vlist)
viewmin = 0 viewmax = 100));
scatterplot x=x y=y/markerattrs=(color=black symbol=circlefilled
size = 0pt) ;
drawline x1 = 0 y1 = 0 x2 = 100 y2 = 100/x1space = layoutpercent
y1space = layoutpercent x2space = layoutpercent y2space = layoutpercent
lineattrs=(pattern = 1 color=red thickness = 1px);
drawtext textattrs = (color = red family = “Times New Roman”
size = 9pt) “layoutpercent, x=0, y=0, BottomLeft”/
x = 0 y = 0 drawspace=layoutpercent
width = 500 widthunit=percent
anchor = Bottomleft border = false;
endlayout;
*2nd cell;
layout overlay/xaxisopts=(label=”X” griddisplay=on
linearopts =(tickvaluelist=(&vlist)
viewmin = 0 viewmax = 100))
yaxisopts=(label=”Y” griddisplay=on
linearopts =(tickvaluelist=(&vlist)
viewmin = 0 viewmax = 100));
scatterplot x=x y=y/markerattrs=(color=black symbol=circlefilled
size = 0pt) ;
drawline x1 = 0 y1 = 0 x2 = 100 y2 = 100/x1space = wallpercent
y1space = wallpercent x2space = wallpercent y2space = wallpercent
lineattrs=(pattern = 1 color=orange thickness = 1px);
drawtext textattrs = (color = orange family = “Times New Roman”
size = 9pt) “wallpercent, x=0, y=0, BottomLeft”/
x = 0 y = 0 drawspace=wallpercent
width = 500 widthunit=percent
anchor = Bottomleft border = false;
endlayout;
*3rd cell;
layout overlay/xaxisopts=(label=”X” griddisplay=on
linearopts =(tickvaluelist=(&vlist)
viewmin = 0 viewmax = 100))
yaxisopts=(label=”Y” griddisplay=on
linearopts =(tickvaluelist=(&vlist)
viewmin = 0 viewmax = 100));
scatterplot x=x y=y/markerattrs=(color=black symbol=circlefilled
size = 0pt) ;
drawline x1 = 0 y1 = 0 x2 = 100 y2 = 100/x1space = datavalue
y1space = datavalue x2space = datavalue y2space = datavalue
lineattrs=(pattern = 1 color=blue thickness = 1px);
drawtext textattrs = (color = blue family = “Times New Roman”
size = 9pt) “datavalue, x=0, y=0, BottomLeft”/
x = 0 y = 0 drawspace=datavalue
width = 500 widthunit=percent
anchor = Bottomleft border = false;
endlayout;
*4th cell;
layout overlay/xaxisopts=(label=”X” griddisplay=on
linearopts =(tickvaluelist=(&vlist)
viewmin = 0 viewmax = 100))
yaxisopts=(label=”Y” griddisplay=on
linearopts =(tickvaluelist=(&vlist)
viewmin = 0 viewmax = 100));
scatterplot x=x y=y/markerattrs=(color=black symbol=circlefilled
size = 0pt) ;
drawline x1 = 0 y1 = 0 x2 = 100 y2 = 100/x1space = graphpercent
y1space = graphpercent x2space = graphpercent y2space = graphpercent
lineattrs=(pattern = 1 color=green thickness = 1px);
drawtext textattrs = (color = green family = “Times New Roman”
size = 9pt) “graphpercent, x=0, y=0, BottomLeft”/
x = 0 y = 0 drawspace=graphpercent
width = 500 widthunit=percent
anchor = Bottomleft border = false;
drawtext textattrs = (color = green family = “Times New Roman”
size = 9pt) “layoutpercent, x=0, y=0, BottomLeft”/
x = 0 y = 0 drawspace=layoutpercent
width = 500 widthunit=percent
anchor = Bottomleft border = false;
drawtext textattrs = (color = green family = “Times New Roman”
size = 9pt) “wallpercent, x=0, y=0, BottomLeft”/
x = 0 y = 0 drawspace=wallpercent
width = 500 widthunit=percent
anchor = Bottomleft border = false;
endlayout;
endlayout;
endgraph;
end;
run;
ods graphics on/width=12cm height=9cm scale=on border=yes;
proc sgrender data=test template=line;
run;
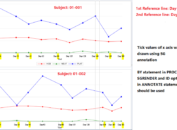
After submitting above code, you will get a graph like below. Red line was drawn on layoutpercent draw space, orange line was drawn on wallpercent draw space, blue line was drawn on datavalue draw area and green line was drawn on graphpercent drawspace.

Understanding how the Graphics Elements are anchored
The graphics elements that we placed in our graph have height and width. To put the elements exactly in the right point, we need to specify an anchor point. And the graphics element is drawn from the anchor point that is placed in the drawing area in the X and Y coordinates that you specify. Following figure shows you all anchor points for a graphics element.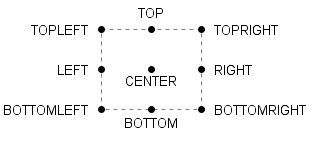
To help you understand the anchor point easily and quickly, I made an example and added 5 short sentences here in the graph. The datavalue space is a square and both X position and Y position of the anchor point can range from 0 to 100. Let’s look at the center of the square (where both X and Y position are 50), you can see the anchor point is in the center of the text “datavalue, x = 50, y = 50, Center” when the anchor point is Center. Anchor point (where X position equals to 50 and Y position equals to 70) is on the left of text “datavalue, x = 50, y = 70, Left” when set the anchor option to be Left. This is because the graphics element was drawn from the anchor point to the right side of this anchor point.
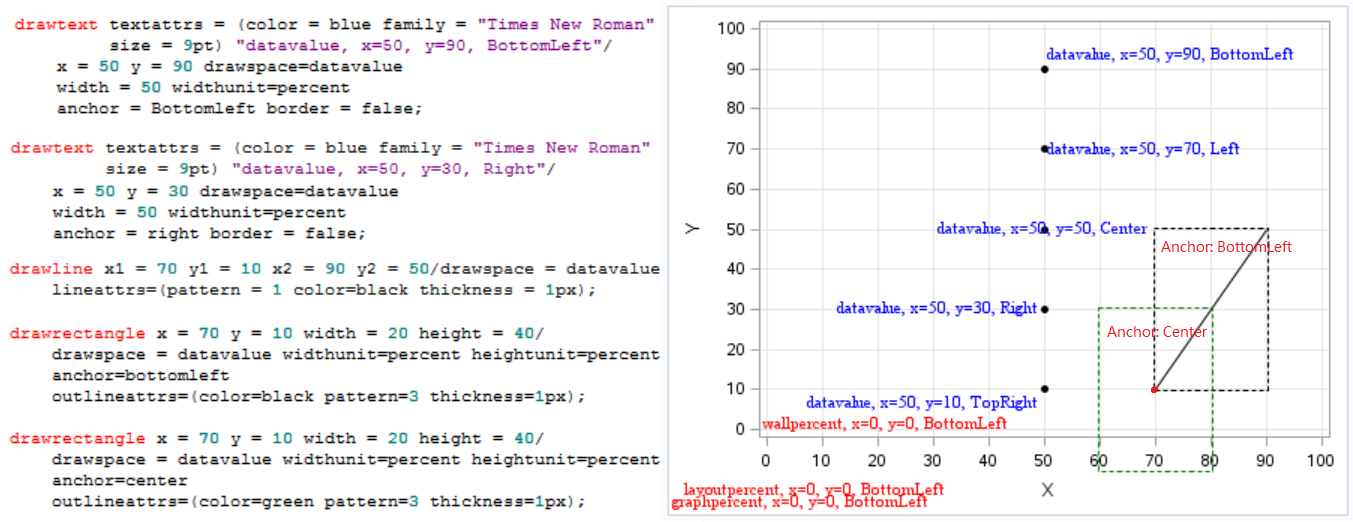
Here I displayed the code and you can modify the code to see what will happen. I strongly recommend you do some practices and this will help you understand the meaning of the anchor point quickly.
Click here to hide/show code
data test;
do y = 10 to 90 by 20;
x =50; output;
end;
run;
%let vlist = 0 10 20 30 40 50 60 70 80 90 100;
proc template;
define statgraph line;
begingraph;
layout overlay/xaxisopts=(label=”X” griddisplay=on
linearopts =(tickvaluelist=(&vlist)
viewmin = 0 viewmax = 100))
yaxisopts=(label=”Y” griddisplay=on
linearopts =(tickvaluelist=(&vlist)
viewmin = 0 viewmax = 100));
scatterplot x=x y=y/markerattrs=(color=black symbol=circlefilled
size = 4pt) ;
drawtext textattrs = (color = blue family = “Times New Roman”
size = 9pt) “datavalue, x=50, y=90, BottomLeft”/
x = 50 y = 90 drawspace=datavalue
width = 50 widthunit=percent
anchor = Bottomleft border = false;
drawtext textattrs = (color = blue family = “Times New Roman”
size = 9pt) “datavalue, x=50, y=70, Left”/
x = 50 y = 70 drawspace=datavalue
width = 50 widthunit=percent
anchor = left border = false;
drawtext textattrs = (color = blue family = “Times New Roman”
size = 9pt) “datavalue, x=50, y=50, Center”/
x = 50 y = 50 drawspace=datavalue
width = 50 widthunit=percent
anchor = center border = false;
drawtext textattrs = (color = blue family = “Times New Roman”
size = 9pt) “datavalue, x=50, y=30, Right”/
x = 50 y = 30 drawspace=datavalue
width = 50 widthunit=percent
anchor = right border = false;
drawtext textattrs = (color = blue family = “Times New Roman”
size = 9pt) “datavalue, x=50, y=10, TopRight”/
x = 50 y = 10 drawspace=datavalue
width = 50 widthunit=percent
anchor = topright border = false;
drawline x1 = 70 y1 = 10 x2 = 90 y2 = 50/drawspace = datavalue
lineattrs=(pattern = 1 color=black thickness = 1px);
drawrectangle x = 70 y = 10 width = 20 height = 40/
drawspace = datavalue widthunit=percent heightunit=percent
anchor=bottomleft
outlineattrs=(color=black pattern=3 thickness=1px);
drawrectangle x = 70 y = 10 width = 20 height = 40/
drawspace = datavalue widthunit=percent heightunit=percent
anchor=center
outlineattrs=(color=green pattern=3 thickness=1px);
drawtext textattrs = (color = red family = “Times New Roman”
size = 9pt) “graphpercent, x=0, y=0, BottomLeft”/
x = 0 y = 0 drawspace=graphpercent
width = 50 widthunit=percent
anchor = Bottomleft border = false;
drawtext textattrs = (color = red family = “Times New Roman”
size = 9pt) “layoutpercent, x=0, y=0, BottomLeft”/
x = 0 y = 0 drawspace=layoutpercent
width = 50 widthunit=percent
anchor = Bottomleft border = false;
drawtext textattrs = (color = red family = “Times New Roman”
size = 9pt) “wallpercent, x=0, y=0, BottomLeft”/
x = 0 y = 0 drawspace=wallpercent
width = 50 widthunit=percent
anchor = Bottomleft border = false;
endlayout;
endgraph;
end;
run;
ods graphics on/width=12cm height=9cm scale=on border=yes;
proc sgrender data=test template=line;
run;
A Summary of Draw Statements
There are few draw statements that you can apply to draw different types of graphics elements. Following table presents you a summary of all draw statements and their syntax.
| Type of Graphics Element | Draw statement |
| Text | DRAWTEXT
DRAWTEXT <TEXTATTRS=(text-options)> “text” / X=x Y=y <options> |
| An arrow | DRAWARROW
DRAWARROW X1=x1 Y1=y1 X2=x2 Y2=y2 / <options> |
| A line | DRAWLINE
DRAWLINE X1=x1 Y1=y1 X2=x2 Y2=y2 / <options> |
| An oval or circle | DRAWOVAL
DRAWOVAL X=x Y=y WIDTH=width HEIGHT=height / <options> |
| A square or rectangle | DRAWRECTANGLE
DRAWRECTANGLE X=x Y=y WIDTH=width HEIGHT=height / <options> |
| A polyline | DRAW statements within a BEGINPOLYLINE block
BEGINPOLYLINE X=origin-x Y=origin-y / <options>; DRAW X=x1 Y=y1; DRAW X=x2 Y=y2; …more DRAW statements… DRAW X=Xn Y=Yn; ENDPOLYLINE; |
| A polygon | DRAW statements within a BEGINPOLYGON block
BEGINPOLYGON X=origin-x Y=origin-y / <options>; DRAW X=x1 Y=y1; DRAW X=x2 Y=y2; …more DRAW statements… DRAW X=origin-x Y=origin-y; ENDPOLYGON; |
| An image | DRAWIMAGE
DRAWIMAGE “image-file.ext” / X=x Y=x <options> |
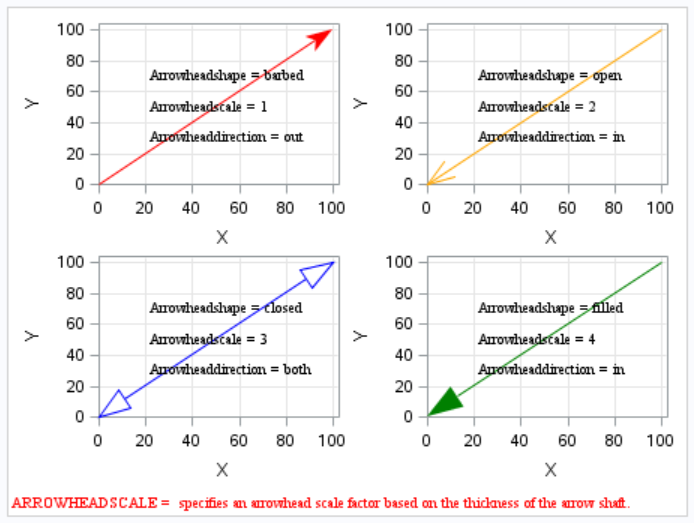
Example
DrawArrow
Click here to hide/show code
data test;
do y = 10 to 90 by 20;
x =50; output;
end;
run;
%let vlist = 0 10 20 30 40 50 60 70 80 90 100;
proc template;
define statgraph line;
begingraph;
layout lattice/pad=(bottom=20)
columns=2 rows=2 rowweights=(.5 .5) columnweights=(.5 .5);
*1st cell;
layout overlay/xaxisopts=(label=”X” griddisplay=on
linearopts =(tickvaluelist=(&vlist)
viewmin = 0 viewmax = 100))
yaxisopts=(label=”Y” griddisplay=on
linearopts =(tickvaluelist=(&vlist)
viewmin = 0 viewmax = 100));
scatterplot x=x y=y/markerattrs=(color=black symbol=circlefilled
size = 0pt) ;
drawarrow x1 = 0 y1 = 0 x2 = 100 y2 = 100/drawspace=datavalue
lineattrs=(pattern = 1 color=red thickness = 1px)
arrowheadshape=barbed arrowheadscale=1 arrowheaddirection=out;
drawtext textattrs = (color = black family = “Times New Roman”
size = 8pt) “Arrowheadshape = barbed”/
x = 20 y = 70 drawspace=datavalue
width = 1000 widthunit=percent
anchor = left border = false;
drawtext textattrs = (color = black family = “Times New Roman”
size = 8pt) “Arrowheadscale = 1″/
x = 20 y = 50 drawspace=datavalue
width = 100 widthunit=percent
anchor = left border = false;
drawtext textattrs = (color = black family = “Times New Roman”
size = 8pt) “Arrowheaddirection = out”/
x = 20 y = 30 drawspace=datavalue
width = 1000 widthunit=percent
anchor = left border = false;
endlayout;
*2nd cell;
layout overlay/xaxisopts=(label=”X” griddisplay=on
linearopts =(tickvaluelist=(&vlist)
viewmin = 0 viewmax = 100))
yaxisopts=(label=”Y” griddisplay=on
linearopts =(tickvaluelist=(&vlist)
viewmin = 0 viewmax = 100));
scatterplot x=x y=y/markerattrs=(color=black symbol=circlefilled
size = 0pt) ;
drawarrow x1 = 0 y1 = 0 x2 = 100 y2 = 100/drawspace=datavalue
lineattrs=(pattern = 1 color=orange thickness = 1px)
arrowheadshape=open arrowheadscale=2 arrowheaddirection=in;
drawtext textattrs = (color = black family = “Times New Roman”
size = 8pt) “Arrowheadshape = open”/
x = 20 y = 70 drawspace=datavalue
width = 1000 widthunit=percent
anchor = left border = false;
drawtext textattrs = (color = black family = “Times New Roman”
size = 8pt) “Arrowheadscale = 2″/
x = 20 y = 50 drawspace=datavalue
width = 100 widthunit=percent
anchor = left border = false;
drawtext textattrs = (color = black family = “Times New Roman”
size = 8pt) “Arrowheaddirection = in”/
x = 20 y = 30 drawspace=datavalue
width = 1000 widthunit=percent
anchor = left border = false;
endlayout;
*3rd cell;
layout overlay/xaxisopts=(label=”X” griddisplay=on
linearopts =(tickvaluelist=(&vlist)
viewmin = 0 viewmax = 100))
yaxisopts=(label=”Y” griddisplay=on
linearopts =(tickvaluelist=(&vlist)
viewmin = 0 viewmax = 100));
scatterplot x=x y=y/markerattrs=(color=black symbol=circlefilled
size = 0pt) ;
drawarrow x1 = 0 y1 = 0 x2 = 100 y2 = 100/drawspace=datavalue
lineattrs=(pattern = 1 color=blue thickness = 1px)
arrowheadshape=closed arrowheadscale=3 arrowheaddirection=both;
drawtext textattrs = (color = black family = “Times New Roman”
size = 8pt) “Arrowheadshape = closed”/
x = 20 y = 70 drawspace=datavalue
width = 1000 widthunit=percent
anchor = left border = false;
drawtext textattrs = (color = black family = “Times New Roman”
size = 8pt) “Arrowheadscale = 3″/
x = 20 y = 50 drawspace=datavalue
width = 100 widthunit=percent
anchor = left border = false;
drawtext textattrs = (color = black family = “Times New Roman”
size = 8pt) “Arrowheaddirection = both”/
x = 20 y = 30 drawspace=datavalue
width = 1000 widthunit=percent
anchor = left border = false;
endlayout;
*4th cell;
layout overlay/xaxisopts=(label=”X” griddisplay=on
linearopts =(tickvaluelist=(&vlist)
viewmin = 0 viewmax = 100))
yaxisopts=(label=”Y” griddisplay=on
linearopts =(tickvaluelist=(&vlist)
viewmin = 0 viewmax = 100));
scatterplot x=x y=y/markerattrs=(color=black symbol=circlefilled
size = 0pt) ;
drawarrow x1 = 0 y1 = 0 x2 = 100 y2 = 100/drawspace=datavalue
lineattrs=(pattern = 1 color=green thickness = 1px)
arrowheadshape=filled arrowheadscale=4 arrowheaddirection=in;
drawtext textattrs = (color = black family = “Times New Roman”
size = 8pt) “Arrowheadshape = filled”/
x = 20 y = 70 drawspace=datavalue
width = 1000 widthunit=percent
anchor = left border = false;
drawtext textattrs = (color = black family = “Times New Roman”
size = 8pt) “Arrowheadscale = 4″/
x = 20 y = 50 drawspace=datavalue
width = 100 widthunit=percent
anchor = left border = false;
drawtext textattrs = (color = black family = “Times New Roman”
size = 8pt) “Arrowheaddirection = in”/
x = 20 y = 30 drawspace=datavalue
width = 1000 widthunit=percent
anchor = left border = false;
drawtext textattrs = (color = red family = “Times New Roman”
size = 8pt) “ARROWHEADSCALE = specifies an arrowhead scale factor based on the thickness of the arrow shaft.”/
x = 0 y = 0 drawspace=graphpercent
width = 1000 widthunit=percent
anchor = bottomleft border = false;
endlayout;
endlayout;
endgraph;
end;
run;
ods graphics on/width=12cm height=9cm scale=on border=yes;
proc sgrender data=test template=line;
run;
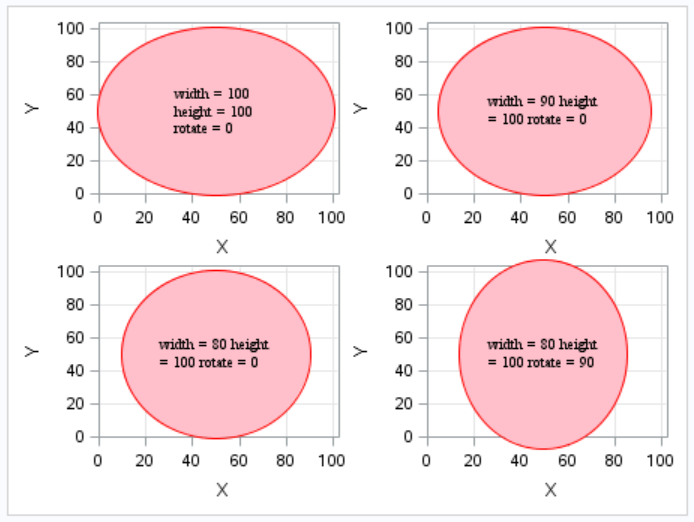
DrawOval
Click here to hide/show code
data test;
do y = 10 to 90 by 20;
x =50; output;
end;
run;
%let vlist = 0 10 20 30 40 50 60 70 80 90 100;
proc template;
define statgraph line;
begingraph;
layout lattice/columns=2 rows=2 rowweights=(.5 .5) columnweights=(.5 .5);
*1st cell;
layout overlay/xaxisopts=(label=”X” griddisplay=on
linearopts =(tickvaluelist=(&vlist)
viewmin = 0 viewmax = 100))
yaxisopts=(label=”Y” griddisplay=on
linearopts =(tickvaluelist=(&vlist)
viewmin = 0 viewmax = 100));
scatterplot x=x y=y/markerattrs=(color=black symbol=circlefilled
size = 0pt) ;
drawoval x = 50 y = 50 width = 100 height = 100/drawspace=datavalue
anchor = center display = all rotate = 0 fillattrs=(color=pink)
outlineattrs=(color=red pattern=solid thickness=1px);
drawtext textattrs = (color = black family = “Times New Roman”
size = 8pt) “width = 100 height = 100 rotate = 0″/
x = 50 y = 50 drawspace=datavalue
width = 50 widthunit=percent
anchor = center border = false;
endlayout;
*2nd cell;
layout overlay/xaxisopts=(label=”X” griddisplay=on
linearopts =(tickvaluelist=(&vlist)
viewmin = 0 viewmax = 100))
yaxisopts=(label=”Y” griddisplay=on
linearopts =(tickvaluelist=(&vlist)
viewmin = 0 viewmax = 100));
scatterplot x=x y=y/markerattrs=(color=black symbol=circlefilled
size = 0pt) ;
drawoval x = 50 y = 50 width = 90 height = 100/drawspace=datavalue
anchor = center display = all rotate = 0 fillattrs=(color=pink)
outlineattrs=(color=red pattern=solid thickness=1px);
drawtext textattrs = (color = black family = “Times New Roman”
size = 8pt) “width = 90 height = 100 rotate = 0″/
x = 50 y = 50 drawspace=datavalue
width = 50 widthunit=percent
anchor = center border = false;
endlayout;
*3rd cell;
layout overlay/xaxisopts=(label=”X” griddisplay=on
linearopts =(tickvaluelist=(&vlist)
viewmin = 0 viewmax = 100))
yaxisopts=(label=”Y” griddisplay=on
linearopts =(tickvaluelist=(&vlist)
viewmin = 0 viewmax = 100));
scatterplot x=x y=y/markerattrs=(color=black symbol=circlefilled
size = 0pt) ;
drawoval x = 50 y = 50 width = 80 height = 100/drawspace=datavalue
anchor = center display = all rotate = 0 fillattrs=(color=pink)
outlineattrs=(color=red pattern=solid thickness=1px);
drawtext textattrs = (color = black family = “Times New Roman”
size = 8pt) “width = 80 height = 100 rotate = 0″/
x = 50 y = 50 drawspace=datavalue
width = 50 widthunit=percent
anchor = center border = false;
endlayout;
*4th cell;
layout overlay/xaxisopts=(label=”X” griddisplay=on
linearopts =(tickvaluelist=(&vlist)
viewmin = 0 viewmax = 100))
yaxisopts=(label=”Y” griddisplay=on
linearopts =(tickvaluelist=(&vlist)
viewmin = 0 viewmax = 100));
scatterplot x=x y=y/markerattrs=(color=black symbol=circlefilled
size = 0pt) ;
drawoval x = 50 y = 50 width = 80 height = 100/drawspace=datavalue
anchor = center display = all rotate = 90 fillattrs=(color=pink)
outlineattrs=(color=red pattern=solid thickness=1px);
drawtext textattrs = (color = black family = “Times New Roman”
size = 8pt) “width = 80 height = 100 rotate = 90″/
x = 50 y = 50 drawspace=datavalue
width = 50 widthunit=percent
anchor = center border = false;
endlayout;
endlayout;
endgraph;
end;
run;
ods graphics on/width=12cm height=9cm scale=on border=yes;
proc sgrender data=test template=line;
run;
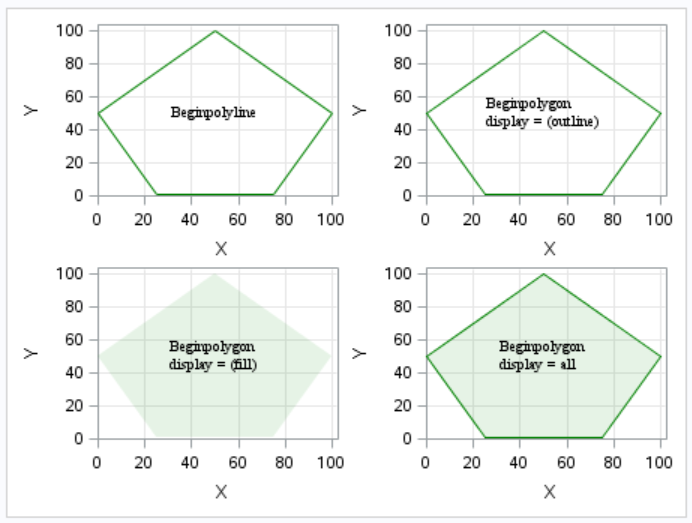
BeginPolyline and BeginPolygon
Click here to hide/show code
data test;
do y = 10 to 90 by 20;
x =50; output;
end;
run;
%let vlist = 0 10 20 30 40 50 60 70 80 90 100;
proc template;
define statgraph line;
begingraph;
layout lattice/columns=2 rows=2 rowweights=(.5 .5) columnweights=(.5 .5);
*1st cell;
layout overlay/xaxisopts=(label=”X” griddisplay=on
linearopts =(tickvaluelist=(&vlist)
viewmin = 0 viewmax = 100))
yaxisopts=(label=”Y” griddisplay=on
linearopts =(tickvaluelist=(&vlist)
viewmin = 0 viewmax = 100));
scatterplot x=x y=y/markerattrs=(color=black symbol=circlefilled
size = 0pt) ;
beginpolyline x = 25 y=1/drawspace=datavalue
lineattrs=(pattern = 1 color=green thickness = 1px);
draw x = 75 y = 1;
draw x = 100 y = 50;
draw x = 50 y = 100;
draw x = 0 y = 50;
draw x = 25 y=1;
endpolyline;
drawtext textattrs = (color = black family = “Times New Roman”
size = 8pt) “Beginpolyline”/
x = 50 y = 50 drawspace=datavalue
width = 50 widthunit=percent
anchor = center border = false;
endlayout;
*2nd cell;
layout overlay/xaxisopts=(label=”X” griddisplay=on
linearopts =(tickvaluelist=(&vlist)
viewmin = 0 viewmax = 100))
yaxisopts=(label=”Y” griddisplay=on
linearopts =(tickvaluelist=(&vlist)
viewmin = 0 viewmax = 100));
scatterplot x=x y=y/markerattrs=(color=black symbol=circlefilled
size = 0pt) ;
beginpolygon x = 25 y=1/ drawspace=datavalue display=(outline)
fillattrs=(color=green transparency=0.9)
outlineattrs=(pattern = 1 color=green thickness = 1px);
draw x = 75 y = 1;
draw x = 100 y = 50;
draw x = 50 y = 100;
draw x = 0 y = 50;
draw x = 25 y=1;
endpolygon;
drawtext textattrs = (color = black family = “Times New Roman”
size = 8pt) “Beginpolygon display = (outline)”/
x = 50 y = 50 drawspace=datavalue
width = 60 widthunit=percent
anchor = center border = false;
endlayout;
*3rd cell;
layout overlay/xaxisopts=(label=”X” griddisplay=on
linearopts =(tickvaluelist=(&vlist)
viewmin = 0 viewmax = 100))
yaxisopts=(label=”Y” griddisplay=on
linearopts =(tickvaluelist=(&vlist)
viewmin = 0 viewmax = 100));
scatterplot x=x y=y/markerattrs=(color=black symbol=circlefilled
size = 0pt) ;
beginpolygon x = 25 y=1/ drawspace=datavalue display=(fill)
fillattrs=(color=green transparency=0.9)
outlineattrs=(pattern = 1 color=green thickness = 1px);
draw x = 75 y = 1;
draw x = 100 y = 50;
draw x = 50 y = 100;
draw x = 0 y = 50;
draw x = 25 y=1;
endpolygon;
drawtext textattrs = (color = black family = “Times New Roman”
size = 8pt) “Beginpolygon display = (fill)”/
x = 50 y = 50 drawspace=datavalue
width = 50 widthunit=percent
anchor = center border = false;
endlayout;
*4th cell;
layout overlay/xaxisopts=(label=”X” griddisplay=on
linearopts =(tickvaluelist=(&vlist)
viewmin = 0 viewmax = 100))
yaxisopts=(label=”Y” griddisplay=on
linearopts =(tickvaluelist=(&vlist)
viewmin = 0 viewmax = 100));
scatterplot x=x y=y/markerattrs=(color=black symbol=circlefilled
size = 0pt) ;
beginpolygon x = 25 y=1/ drawspace=datavalue display=all
fillattrs=(color=green transparency=0.9)
outlineattrs=(pattern = 1 color=green thickness = 1px);
draw x = 75 y = 1;
draw x = 100 y = 50;
draw x = 50 y = 100;
draw x = 0 y = 50;
draw x = 25 y=1;
endpolygon;
drawtext textattrs = (color = black family = “Times New Roman”
size = 8pt) “Beginpolygon display = all”/
x = 50 y = 50 drawspace=datavalue
width = 50 widthunit=percent
anchor = center border = false;
endlayout;
endlayout;
endgraph;
end;
run;
ods graphics on/width=12cm height=9cm scale=on border=yes;
proc sgrender data=test template=line;
run;