In last post, I described how to compute ORR (Overall Response Rate) for each group, usually treatment group in clinical trial industry. Here let’s move forward and see how to compute Odds Ratio (usually abbreviated as “OR”) if we’d like to know whether the study drug has something to do with ORR.
Before digging deeper, I’d like to give you a brief introduction on Probability and Odds. These two terminologies can enable you to understand Odds Ratio easily.
Dummy data to be used in this post
Below table shows you the data that I just made up and these data will be used later for illustration. There are 2 groups – Placebo and Study Drug. Each treatment group consists of 10 patients. And their BOR are listed in the 2nd and 4th column respectively.
| Placebo | Study Drug | ||
| Subject Number | Best of Response | Subject Number | Best of Response |
| 01-001 | SD | 02-001 | PR |
| 01-002 | PR | 02-002 | CR |
| 01-003 | SD | 02-003 | CR |
| 01-004 | PD | 02-004 | PR |
| 01-005 | SD | 02-005 | SD |
| 01-006 | PD | 02-006 | SD |
| 01-007 | SD | 02-007 | SD |
| 01-008 | PD | 02-008 | SD |
| 01-009 | PD | 02-009 | SD |
| 01-010 | SD | 02-010 | SD |
ORR is fundamentally a Probability
Probability is defined as the fraction of desired outcomes (CR and PR in this post) in the context of every possible outcome. The value is between 0 and 1, where 0 would mean an impossible event while 1 would implies an inevitable event.
The probability of CR + PR would be calculated by taking the number of subjects with CR/PR and dividing it by the total number of subjects for each treatment group. In our case, the probability of CR + PR for place group is (1 PR)/10 while the probability of CR +PR for study drug group is (2 PR + 2 CR) /10 which equals to 40%.
Odds is fundamentally a ratio of favorable outcomes to unfavorable outcomes
Odds are a ratio of favorable outcomes (CR + PR) to unfavorable outcomes (other BOR except for CR and PR). The denominator is number of subjects with unfavorable outcomes. Notice that for Probability, the denominator is number of subjects within the entire group. Odds can have any value from 0 to infinity.
Here we change our above dummy data table into following 2×2 table. You can see that odds for ORR (CR + PR) would be mathematically calculated by 1/9 for placebo group and 4/6 for study drug group.
| Placebo | Study Drug | |
| ORR (CR + PR) | 1 | 4 |
| Non-ORR | 9 | 6 |
Odds Ratio is fundamentally a ratio of Odds
Odds ratio (OR) represents the odds that an event (ORR – CR + PR) will occur given a particular exposure (taking study drug in this post), compared to the odds of the event (ORR – CR + PR) occurring in the absence of that exposure (taking placebo). Odds ratio are most commonly used in case-control studies.
Here is the interpretation of odds ratio.
OR = 1 Exposure (study drug) does not affect odds of event (ORR – CR + PR)
OR > 1 Exposure (study drug) associated with higher odds of event (ORR – CR + PR)
OR < 1 Exposure (study drug) associated with lower odds of event (ORR – CR + PR)
Let’s move back and see our above 2×2 table, odds ratio in our post would be calculated as (4/6)/(1/9)which equivalents to (4×9)/(6×1) which equals to 6. It implies that study drug leads to higher odds of ORR and it favors patients more when comparing with placebo.
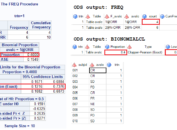
Sample code
PROC FREQ can be used here for computing odds ratio and even to test if the odds ratio equals to 1. Notice that I have applied FORMAT here in order to avoid manipulating and ordering my data. Otherwise, we have to create a new variable to put values of AVALC into two categories and then put data for study drug group before data for placebo group. This is an extremely useful skill which I strongly recommend you to have a try in future when you writing your own code.
Click here to hide/show code
data bor;
input subjid $ 1-6 avalc $ 8-9 subjid1 $ 10-16 avalc1 $ 18-19 ;
datalines;
01-001 SD 02-001 PR
01-002 PR 02-002 CR
01-003 SD 02-003 CR
01-004 PD 02-004 PR
01-005 SD 02-005 SD
01-006 PD 02-006 SD
01-007 SD 02-007 SD
01-008 PD 02-008 SD
01-009 PD 02-009 SD
01-010 SD 02-010 SD
;
run;
data bor(drop=subjid1 avalc1);
set bor;
trtn =1; output;
trtn =2; avalc = avalc1; subjid = subjid1; output;
run;
proc format;
value trt
1 = “2@Placebo”
2 = “1@Study Drug”
;
value $bor
“CR”, “PR” = “1@ORR”
“SD”, “PD”, “NE” = “2@N-ORR”
;
quit;
proc sort data=bor; by descending trtn avalc; run;
ods output CommonRelRisks=odds CommonOddsRatioTest=oddstest;
proc freq data=bor order=formatted;
tables trtn*avalc;
exact comor ;
format trtn trt. avalc $bor.;
run;
ods output close;
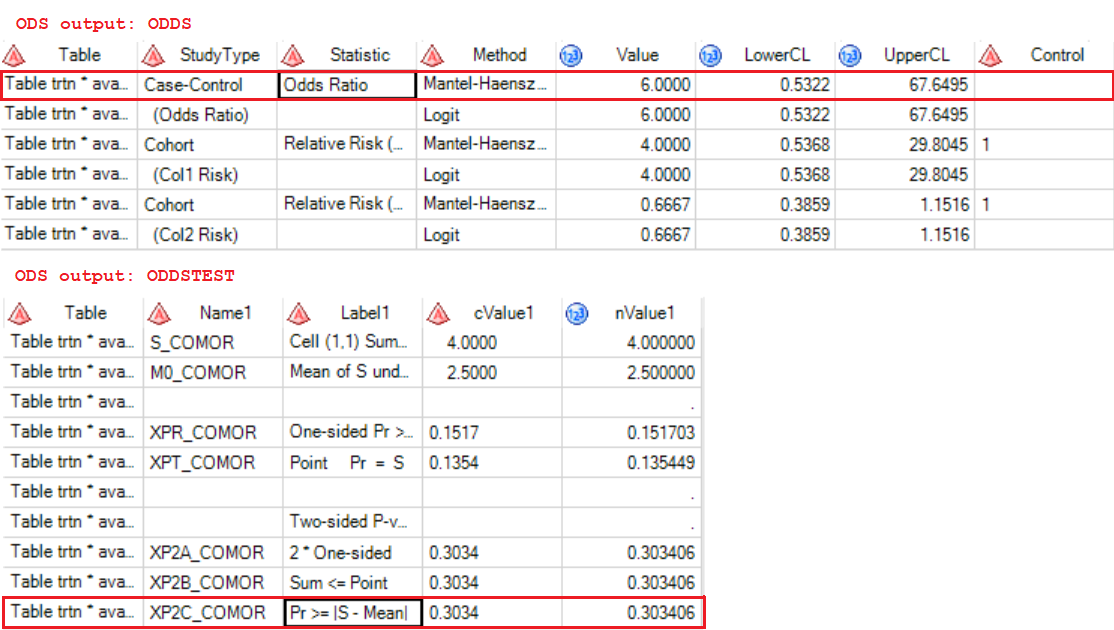
And here are the results. The odds ratio is 6 which exactly equals to what we got before. As for the test of odds ratio, the p-value is 0.303 which far bigger than 0.05 and thus denies the hypothesis that odds ratio equals to 1. Therefore, the study drug indeed has an effect on overall response rate.
Sample code if you don’t use FORMAT
Please note that if you don’t put study drug before placebo, you will get odds ratio of odds of ORR in placebo group compared to odds of ORR in study drug group. Here I also attached sample code without using FORMAT. You will find the advantages of using FORMAT by yourself. 😊
Click here to hide/show code
data bor;
input subjid $ 1-6 avalc $ 8-9 subjid1 $ 10-16 avalc1 $ 18-19 ;
datalines;
01-001 SD 02-001 PR
01-002 PR 02-002 CR
01-003 SD 02-003 CR
01-004 PD 02-004 PR
01-005 SD 02-005 SD
01-006 PD 02-006 SD
01-007 SD 02-007 SD
01-008 PD 02-008 SD
01-009 PD 02-009 SD
01-010 SD 02-010 SD
;
run;
data bor(drop=subjid1 avalc1);
set bor;
trtn =1; output;
trtn =2; avalc = avalc1; subjid = subjid1; output;
run;
data bor;
set bor;
if avalc in (“CR”, “PR”) then typ = 1;
else typ = 2;
run;
proc sort data=bor; by descending trtn typ; run;
ods output CommonRelRisks=odds CommonOddsRatioTest=oddstest;
proc freq data=bor order=data;
tables trtn*typ;
exact comor ;
run;
ods output close;